You bought a coin because everyone on social media was talking about it. The price looked unstoppable. Then, two weeks later, it dropped 60% and the hype vanished. Sound familiar? Most crypto losses trace back to one root cause: acting on noise instead of data. The good news is that analyzing crypto trends is a learnable skill, and you do not need to be a professional trader to do it well. In this guide, we walk through five practical steps covering technical, fundamental, and on-chain analysis so you can make more confident, data-driven decisions at any experience level.
Table of Contents
- What you need before you start
- Step 1: Use technical analysis to identify trend signals
- Step 2: Apply fundamental analysis for long-term insight
- Step 3: Perform on-chain analysis for real-time signals
- Step 4: Combine methods for reliable results
- Step 5: Monitor, adapt, and measure your results
- Make crypto trend analysis easier with CryptoCracker
- Frequently asked questions
Key Takeaways
| Point | Details |
|---|---|
| Use multiple analysis types | Combining technical, fundamental, and on-chain methods provides more accurate crypto trend predictions. |
| Tools and data matter | Reliable sources and clear metrics give you an edge over guesswork and market hype. |
| Verify and adapt regularly | Regularly measure and adjust your strategy to respond to changing market conditions. |
| Be aware of pitfalls | Watch for manipulation and avoid relying on a single data point when making investment choices. |
What you need before you start
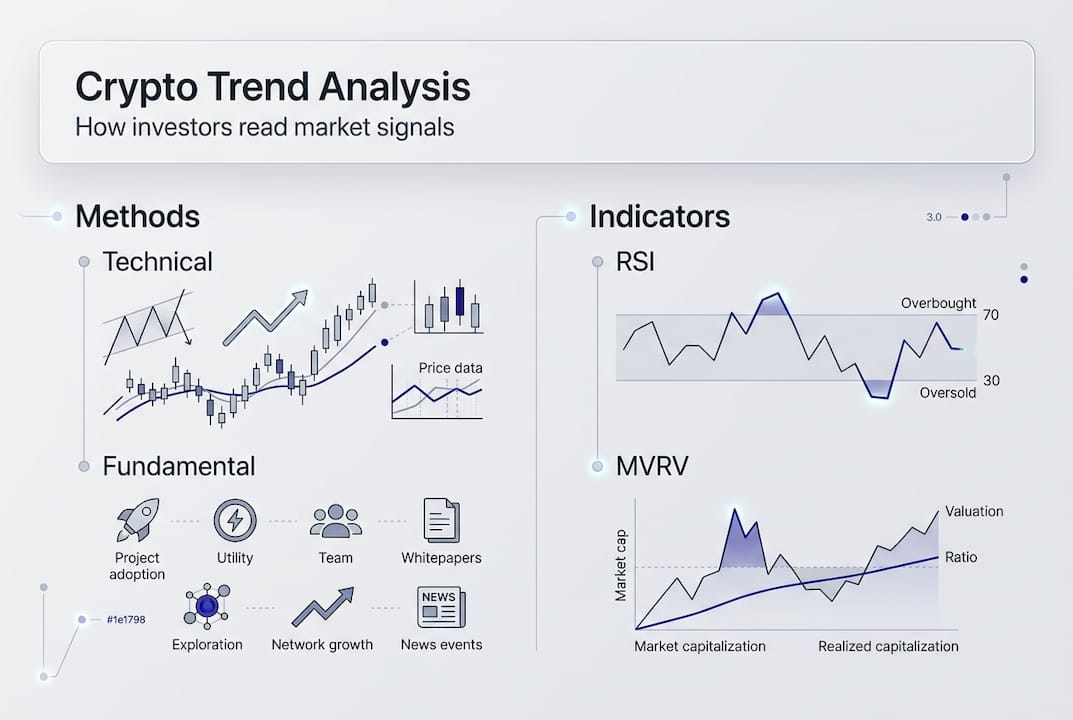
Before diving into the steps, it is crucial to know what you will need and why each piece matters. Core methodologies for analyzing crypto trends include technical analysis (TA), fundamental analysis (FA), and on-chain analysis. Each one answers a different question: TA tells you what the market is doing right now, FA tells you why a project might have lasting value, and on-chain analysis tells you who is actually moving money and where.
Here is a quick overview of the tools and data sources tied to each method:
| Method | Key tools | Primary data sources |
|---|---|---|
| Technical analysis | Candlestick charts, RSI, moving averages | TradingView, exchange charts |
| Fundamental analysis | Whitepaper review, tokenomics models | Project websites, CoinGecko |
| On-chain analysis | MVRV Z-Score, active addresses, whale trackers | Glassnode, CryptoQuant |
A few terms worth knowing before you proceed:
- Support/resistance: Price levels where buying or selling pressure tends to cluster
- Whitepaper: A project’s official document explaining its technology and purpose
- Tokenomics: The supply, distribution, and incentive structure of a crypto asset
- MVRV Z-Score: A metric comparing market value to realized value to gauge over or undervaluation
Our crypto trend analysis guide and crypto analysis fundamentals pages go deeper on each of these if you want to build your foundation first.
Pro Tip: Always cross-check data from at least two independent sources before acting. A single platform can have delays, errors, or incentives to present data in a favorable light.
Step 1: Use technical analysis to identify trend signals
Once you have gathered your tools, the first practical step is interpreting what the market charts are signaling. Technical analysis uses historical price and volume data to forecast future movement, and it starts with reading candlestick charts.
Each candlestick shows four data points: open, close, high, and low price within a set time period. A green candle means the price closed higher than it opened. A red candle means the opposite. Patterns formed by groups of candles, like a “hammer” or “engulfing” pattern, can hint at reversals or continuations.
Here is a simple process for using TA effectively:
- Set your timeframe. Use longer timeframes (daily, weekly) for trend direction and shorter ones (1-hour, 4-hour) for entry timing.
- Apply moving averages. The 50-day and 200-day moving averages are widely watched. When the 50-day crosses above the 200-day, it is called a “golden cross” and often signals upward momentum.
- Check the RSI. The Relative Strength Index (RSI) measures momentum on a scale of 0 to 100. Readings above 70 suggest overbought conditions; below 30 suggests oversold.
- Look for volume confirmation. A price breakout with high volume is more reliable than one with low volume.
- Watch for false breakouts. Price can briefly pierce a resistance level and then reverse, trapping buyers. Always wait for a candle close above the level before acting.
Rising active addresses often correlate with price uptrends, making key crypto indicators like network activity just as important as price charts alone. Our crypto trend indicators tool and market analysis tool can help you visualize these signals without manual chart reading.
Pro Tip: Never rely on a single indicator. Combine RSI with moving averages and volume to build a stronger, more reliable signal before making any move.
Step 2: Apply fundamental analysis for long-term insight
While charts give you momentum clues, fundamentals let you judge if a trend is truly investable. Fundamental analysis evaluates whitepapers, tokenomics, team background, use cases, roadmap, and community strength to determine whether a project has real staying power.
Here is a practical checklist to work through when evaluating any crypto project:
- Whitepaper: Does it clearly explain the problem being solved and the technical approach?
- Token supply and distribution: Is the supply capped? Are large portions held by insiders with short vesting periods?
- Vesting schedules: Long vesting periods for team tokens reduce the risk of sudden sell-offs
- Team background: Are the founders and developers publicly known with verifiable track records?
- Use cases: Does the project solve a real problem, or is it speculative by design?
- Roadmap: Are milestones realistic and regularly updated?
- Community: Is there genuine engagement, or does it look artificially inflated?
A word of caution on tokenomics: Projects that allocate large percentages of supply to early investors with short unlock periods create what analysts call “exit liquidity” risk. You may be buying tokens that insiders are waiting to sell. Always review the fundamental checklist before committing capital.
Strong fundamentals do not guarantee short-term price gains, but they dramatically improve the odds that a project survives a bear market. Green candles can appear on any chart, including projects with zero real-world utility. Our guides on analyzing crypto fundamentals and market analysis for investors can help you build this evaluation habit.

Step 3: Perform on-chain analysis for real-time signals
Even the strongest project needs validation from real market activity. On-chain analysis reads public blockchain data to reveal what investors are actually doing, not just what they are saying.
Here is a comparison of the most useful on-chain metrics:
| Metric | What it measures | Trend signal |
|---|---|---|
| MVRV Z-Score | Market value vs. realized value | Above 5 = overvalued; below 0 = undervalued |
| Active addresses | Number of unique wallets transacting daily | Rising count often precedes price increases |
| Exchange inflows/outflows | Coins moving onto or off exchanges | High inflows suggest selling pressure |
| Whale movements | Large wallet transfers | Often precede major price moves |
| SOPR | Profit/loss ratio of coins being moved | Above 1 = holders selling at profit |
The MVRV Z-Score is one of the most reliable cycle indicators available. A score above 5 has historically marked market tops, while a score below 0 has marked major buying opportunities. That is a powerful benchmark to keep on your radar.
Whale and exchange flows deserve special attention. When large amounts of Bitcoin or Ethereum move onto exchanges, it often signals that big holders are preparing to sell. The reverse, coins moving off exchanges into cold wallets, tends to signal accumulation. You can track these patterns using on-chain data metrics from platforms like Glassnode or CryptoQuant.
Never use a single on-chain metric in isolation. Context matters. A spike in exchange inflows during a bull market may simply reflect profit-taking, not a full reversal. Our article on tracking BTC and altcoin correlations shows how to layer these signals effectively.
Step 4: Combine methods for reliable results
With individual tools mastered, the next skill is learning to cross-validate for a higher probability assessment. Combining methods for confluence, meaning multiple signals pointing in the same direction, is what separates disciplined investors from reactive ones.
Here is how to build a cross-confirmed view:
- Start with TA for direction. Identify whether the asset is in an uptrend, downtrend, or consolidation phase using moving averages and price structure.
- Check FA for quality. Confirm the project has solid fundamentals before treating any bullish chart signal as actionable.
- Validate with on-chain data. Look for rising active addresses, declining exchange inflows, and a healthy MVRV Z-Score to support the TA picture.
- Look for confluence. If all three methods align, your confidence level should rise. If they conflict, wait for clarity.
- Watch for manipulation signals. Large exchange-internal transfers can artificially inflate on-chain volume. These are not real market moves and can mislead analysis.
False breakouts and edge case traps are most dangerous when you are relying on just one method. A chart may look bullish while on-chain data shows whales distributing. That conflict is a warning sign, not a green light. The importance of confluence cannot be overstated when real capital is at stake.
Pro Tip: If TA says buy but FA and on-chain say caution, trust the caution. Patience is a strategy.
Step 5: Monitor, adapt, and measure your results
Now that your analysis is complete, the last step is to put it to work and iterate as markets evolve. Analysis is not a one-time event. Markets shift, narratives change, and new data emerges constantly.
Here is what to keep tracking on an ongoing basis:
- BTC dominance: When Bitcoin’s share of total crypto market cap rises, altcoins often underperform. When it falls, altcoins tend to outperform.
- Altcoin vs. BTC performance: Tracking how altcoins perform relative to Bitcoin reveals rotation patterns and risk appetite in the market.
- Memecoin volume: Surging memecoin activity often signals speculative excess and can precede broader market corrections.
- Your own trade history: Backtesting your past decisions against what the data showed at the time is one of the fastest ways to improve.
For portfolio management, tracking BTC and altcoin correlations alongside memecoin volumes as momentum signals gives you a fuller picture of where the market cycle stands. Our resources on crypto portfolio strategies and crypto risk management can help you build a consistent review process.
Adjusting your strategy based on new data is not a sign of weakness. It is exactly what good investors do. Markets reward flexibility, not stubbornness.
Pro Tip: Set price and metric alerts on your tracking tools so you are notified when key thresholds are crossed. Automated alerts remove emotion from the monitoring process and keep you consistent.
Make crypto trend analysis easier with CryptoCracker
If you want to skip the manual process and benefit from automated insights, here is how we can help. At CryptoCracker, we have built a platform that brings TA, FA, and on-chain signals together in one clean, user-friendly dashboard. You do not need to juggle five different tools or spend hours reading charts.

Our market analysis tool gives you real-time trend signals, while portfolio optimization with CryptoCracker helps you act on those signals with confidence. We also offer features focused on reducing trading risk so your portfolio is protected even when markets get unpredictable. Whether you are just starting out or refining a strategy you have used for years, CryptoCracker is designed to make smarter investing genuinely accessible.
Frequently asked questions
What is the difference between technical, fundamental, and on-chain analysis?
Technical analysis focuses on price charts and momentum, fundamental analysis evaluates project quality and long-term value, and on-chain analysis reads actual blockchain activity to reveal real investor behavior.
Which on-chain metric is best for spotting crypto trend reversals?
Changes in whale and exchange flow signals often appear before price moves, making them one of the most reliable early warning tools available to investors.
How can I avoid common mistakes in crypto trend analysis?
Always combine methods and never rely on a single data point. Single-metric reliance is risky because individual indicators are easily distorted by noise or deliberate manipulation.
Why did my technical analysis fail in a strong trend?
False breakouts and irregular exchange movements can make charts misleading. Always cross-check with fundamentals and on-chain sentiment before acting on a chart signal alone.
What performance benchmarks should I track when analyzing crypto trends?
Watch the MVRV Z-Score, BTC dominance, and active addresses together. These three metrics provide a well-rounded view of where the market stands in its cycle.