Cryptocurrency investing can feel overwhelming when markets swing wildly and trend signals contradict each other. Many investors struggle to separate genuine opportunities from noise, leading to mistimed trades and missed gains. This guide cuts through the complexity by breaking down proven trend analysis methods into clear, actionable steps. You’ll learn which tools matter most, how to spot reliable patterns, and how to optimize your portfolio using data-driven insights that work in volatile crypto markets.
Table of Contents
- Key takeaways
- What you need: essential tools and knowledge for crypto trend analysis
- How to perform crypto trend analysis: step-by-step process for investors
- Risks, pitfalls, and expert nuances in crypto trend analysis
- Optimizing your crypto portfolio with trend analysis insights
- Discover smart crypto tools to enhance your investing
- Frequently asked questions
Key Takeaways
| Point | Details |
|---|---|
| Core trend tools | Core trend analysis relies on candlestick charts, moving averages, RSI, MACD, and volume confirmation to identify momentum and validate trends. |
| Timeframe approach | Beginners should use daily timeframes with 2 to 3 indicators to reduce noise and improve signal reliability. |
| Pattern reliability | Chart patterns like head and shoulders, double tops, and triangles have about 80 percent success when confirmed on higher timeframes and supported by volume. |
| Volume confirmation rule | Pro tip is to always confirm pattern signals with volume because rising volume validates breakouts and declining volume often leads to reversals. |
What you need: essential tools and knowledge for crypto trend analysis
Successful crypto trend analysis starts with the right toolkit and a clear understanding of how each component works. Core mechanics of crypto trend analysis include technical tools like candlestick charts, support and resistance levels, moving averages, RSI, MACD, volume confirmation, and chart patterns. These tools help you visualize price action, identify momentum shifts, and confirm whether a trend has real strength or represents a temporary blip.
Candlestick charts form your visual foundation, showing open, high, low, and close prices for each period. Support and resistance levels mark price zones where buying or selling pressure historically concentrates. Moving averages smooth out price noise, with the 200-day simple moving average (SMA) indicating long-term trends and the 20-day exponential moving average (EMA) capturing shorter-term momentum. The Relative Strength Index (RSI) measures whether an asset is overbought above 70 or oversold below 30. MACD (Moving Average Convergence Divergence) tracks momentum changes through the relationship between two moving averages. Volume confirmation ensures that price moves have genuine participation rather than thin trading that can reverse quickly.
Beginners start analyzing daily timeframes with 2-3 key indicators for reliable signals. Shorter timeframes like 15-minute or hourly charts contain more noise and false signals that can mislead new traders. Daily charts provide enough data points to spot meaningful patterns while filtering out random fluctuations. Start with one moving average, RSI, and volume to avoid analysis paralysis.
Chart patterns like head and shoulders, double tops, and triangles have roughly 80% success rates when confirmed on higher timeframes. These geometric formations signal potential reversals or continuations based on how price tests previous levels. A head and shoulders pattern suggests an uptrend may reverse, while an ascending triangle often precedes a breakout to the upside. Use the crypto market analysis tool to identify these patterns across multiple assets simultaneously.
Pro Tip: Always confirm pattern signals with volume to avoid false breakouts. A breakout above resistance with declining volume often fails and reverses quickly, while increasing volume validates the move and suggests follow-through.
| Tool | Primary purpose | Typical setting |
|---|---|---|
| 200 SMA | Long-term trend direction | 200-day period |
| 20 EMA | Short-term momentum | 20-day period |
| RSI | Overbought/oversold conditions | 14-period, 30/70 thresholds |
| MACD | Momentum shifts | 12, 26, 9 periods |
| Volume | Confirm price moves | Compare to 20-day average |
Explore best crypto trading indicators for deeper dives into how each tool performs across different market conditions.
How to perform crypto trend analysis: step-by-step process for investors
Following a systematic workflow transforms scattered observations into actionable trading decisions. Workflow: determine trend, identify levels, spot patterns, confirm volume for reliable analysis. This sequence ensures you evaluate each element in logical order rather than jumping to conclusions based on isolated signals.
-
Determine the overall market trend using moving averages and RSI. Check whether price trades above or below the 200 SMA to establish the primary direction. If Bitcoin trades at $68,000 with the 200 SMA at $62,000, you’re in an uptrend. Confirm with RSI, if it oscillates between 40 and 80, bullish momentum persists. When RSI stays below 50 for extended periods, bearish pressure dominates.
-
Identify key support and resistance price levels to gauge entry and exit points. Support represents price zones where buying interest historically emerged, preventing further declines. Resistance marks levels where selling pressure stopped previous rallies. Draw horizontal lines connecting at least two previous touches at similar prices. If Ethereum bounced off $3,200 three times in recent months, that level represents strong support.
-
Spot classic chart patterns such as head and shoulders or double tops for reversal or continuation signals. A double top forms when price reaches a similar high twice, fails to break through, then declines below the valley between peaks. This pattern suggests the uptrend exhausted itself. Ascending triangles show higher lows converging with flat resistance, typically breaking upward. Measure the pattern’s height and project it from the breakout point to estimate potential price targets.
-
Confirm signals with increasing volume to avoid false breakouts. Volume confirms breakouts, essential for avoiding fakeouts. When price breaks resistance on volume 50% above the 20-day average, the move likely continues. Breakouts on low volume often reverse within days as liquidity dries up and early buyers exit.
-
Document your analysis and set alerts for key levels. Write down your entry price, stop loss, and profit targets before executing trades. Set price alerts at support, resistance, and breakout levels so you can monitor multiple assets without constant screen time. Review your analysis weekly to adjust for new information.
The cryptocurrency analysis how to analyse resource provides templates for structuring your analysis consistently. Use the trend indicator to predict future price movements based on historical pattern success rates.
Pro Tip: Avoid low timeframes as beginners to reduce noise-related errors. Stick to daily and weekly charts until you consistently profit, then experiment with shorter periods if your strategy requires it.
Risks, pitfalls, and expert nuances in crypto trend analysis
Even well-executed technical analysis faces significant challenges in cryptocurrency markets. High volatility, 24/7 trading, liquidity runs, fakeouts challenge technical analysis. Unlike traditional markets with circuit breakers and closing bells, crypto never stops, creating conditions where patterns break down or trigger prematurely.

Crypto markets exhibit extreme volatility compared to stocks or forex, with 10% daily swings common even for large-cap assets. This volatility makes support and resistance levels less reliable as prices blast through them during panic or euphoria. The 24/7 operation means news breaks at any hour, triggering moves while you sleep. Liquidity runs occur when large traders intentionally push price through stop-loss clusters to grab cheap coins before reversing direction. These manipulative moves create false breakouts that trap retail traders.
Fakeouts represent one of the most frustrating pitfalls. Price breaks above resistance, you enter long, then immediately reverses and stops you out at a loss. This happens because technical levels become self-fulfilling prophecies that sophisticated traders exploit. They know where retail stops cluster and gun for those levels to create liquidity for their larger positions.
Technical analysis alone often lags and ignores liquidity and volume nuances that drive actual price action. Indicators calculate from past prices, so they inherently trail current market conditions. By the time RSI shows oversold, the worst selling may have already occurred. Hybrid approaches combining TA, FA, and quant models yield better results. Fundamental analysis examines project developments, adoption metrics, and competitive positioning. On-chain analysis tracks wallet movements, exchange flows, and network activity. Combining these perspectives provides context that pure chart reading misses.
- Volatility traps: Patterns that work in stable markets fail when 20% moves happen overnight
- Liquidity manipulation: Large players hunt stop losses, creating false signals
- Regime shifts: Market structure changes make historical patterns less predictive
- Lagging indicators: Signals arrive after optimal entry points have passed
- Confirmation bias: Seeing patterns that support your existing position rather than objective reality
Mitigate these risks by using wider stop losses that account for crypto’s volatility, typically 8-12% rather than the 2-3% common in stocks. Reduce position sizes to compensate for wider stops, maintaining consistent risk per trade. Verify technical signals with on-chain data like exchange inflows (bearish) or outflows (bullish). Monitor macro factors including Federal Reserve policy, dollar strength, and regulatory developments that can override technical setups.
“Success in crypto markets requires understanding liquidity flows and regime awareness more than pattern recognition. The traders who profit consistently combine multiple data sources and adapt their approach as market structure evolves.”
Explore reduce crypto trading risk strategies that address these specific challenges. The market analysis crypto guide explains how to integrate different analytical approaches into a cohesive framework.
Optimizing your crypto portfolio with trend analysis insights
Trend analysis becomes exponentially more powerful when applied to portfolio construction rather than individual trades. Reinforcement learning dynamic allocation outperforms buy-hold with 85% cumulative returns and better Sharpe ratios. This approach uses machine learning algorithms that continuously adjust position sizes based on market conditions, increasing exposure during favorable trends and reducing it during uncertainty.
Markowitz mean-variance and entropy-enhanced models spread risk effectively across multiple assets. The Markowitz model calculates optimal weights that maximize expected return for a given risk level by analyzing historical correlations between assets. When Bitcoin and Ethereum move together, diversification benefits decrease. Adding assets with lower correlation like certain DeFi tokens or layer-2 solutions improves the risk-return profile.
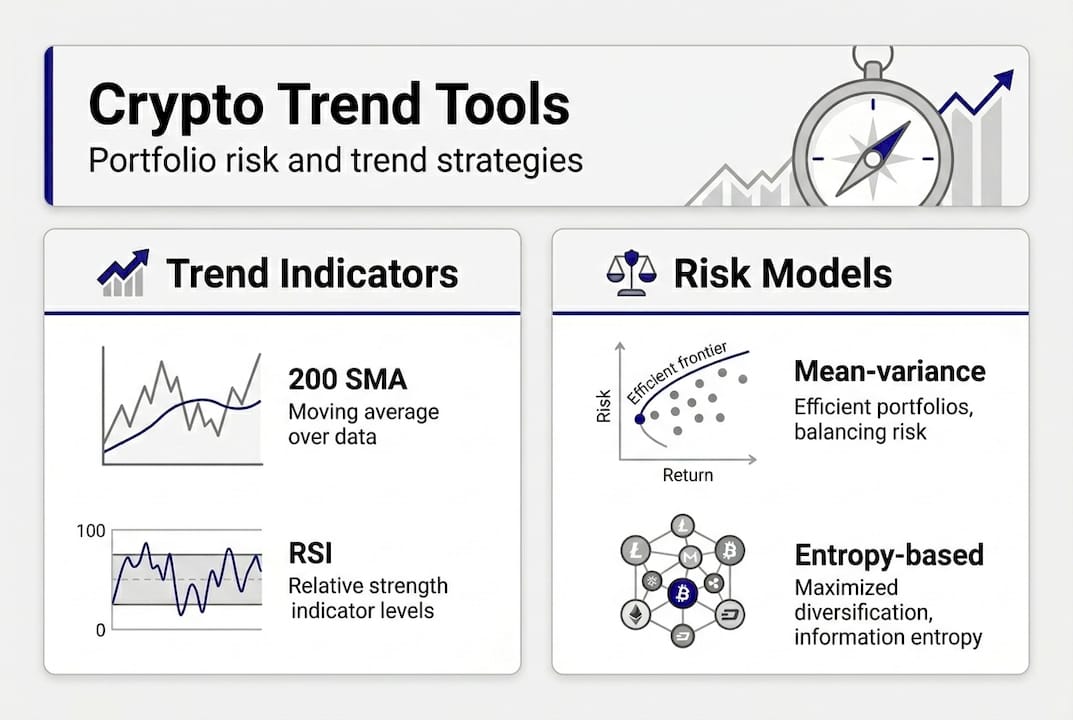
Entropy-enhanced models go further by measuring uncertainty in return distributions, not just variance. They allocate more to assets with predictable behavior and less to those with erratic patterns. Sharpe ratio maximization focuses purely on risk-adjusted returns, seeking the highest return per unit of volatility. This approach often concentrates positions in a few high-performing assets rather than broad diversification.
| Model | Key strength | Typical Sharpe ratio | Best for |
|---|---|---|---|
| Markowitz mean-variance | Balances return and risk systematically | 0.8-1.2 | Risk-averse investors |
| Sharpe maximization | Highest risk-adjusted returns | 1.0-1.5 | Performance focused |
| Entropy-enhanced | Handles uncertainty better | 0.9-1.3 | Volatile markets |
| Reinforcement learning | Adapts to changing conditions | 1.2-1.8 | Active management |
| Simple equal-weight | Easy to implement and rebalance | 0.6-1.0 | Beginners |
Diversification provides multiple benefits beyond just reducing volatility:
- Correlation reduction: Combining assets that move independently smooths portfolio returns
- Drawdown protection: When one asset crashes, others may hold steady or rise
- Opportunity capture: Exposure to multiple trends increases chances of catching winners
- Rebalancing alpha: Systematically selling highs and buying lows generates excess returns
- Psychological comfort: Smaller individual position sizes reduce emotional decision making
Combined portfolio strategies incorporating both Bitcoin and Ethereum with European stocks improved Sharpe ratios by 15-20% compared to crypto-only allocations in recent studies. The low correlation between crypto and traditional assets during certain periods provides genuine diversification, though this relationship varies over time. During March 2020’s COVID crash, correlations spiked as everything sold off together, temporarily eliminating diversification benefits.
Pro Tip: Dynamic allocation with reinforcement learning adapts better to market shifts than static allocations. Rather than setting fixed percentages and rebalancing quarterly, these systems adjust daily based on momentum, volatility, and correlation changes. This responsiveness captures trends early and exits before major reversals.
Discover how cryptocracker optimises portfolio using similar quantitative models. Explore top crypto trading strategies that combine trend analysis with systematic position sizing.
Discover smart crypto tools to enhance your investing
Putting trend analysis into practice requires tools that simplify complex data and automate routine decisions. CryptoCracker provides cryptocurrency wallets guide and monitoring features that track your holdings across multiple platforms in real time. You see exactly how your portfolio performs against benchmarks and receive alerts when positions move outside your target ranges.

The platform’s optimise your portfolio feature uses quantitative models similar to those discussed earlier, automatically suggesting rebalancing actions based on current market conditions. Rather than manually calculating optimal weights, you get specific recommendations with one-click execution through secure Coinbase API integration. Automated trading features implement your chosen strategies consistently without emotional interference, executing trades at predetermined levels even when fear or greed might override your judgment.
Risk management tools help you reduce crypto trading risk through position sizing calculators, stop-loss automation, and drawdown alerts. Set your maximum acceptable loss per trade and per month, and the system prevents you from exceeding those limits. Try CryptoCracker to simplify the complex analysis steps covered in this guide while enhancing your results through data-driven decision making.
Frequently asked questions
Is technical analysis reliable for crypto markets?
Technical analysis provides useful insights but has significant limitations due to crypto’s extreme volatility and 24/7 operation. Patterns that work in traditional markets often fail or trigger false signals in crypto. Combining TA with fundamental analysis, on-chain metrics, and macro factors substantially improves reliability. Use technical tools as one input among several rather than your sole decision framework.
What are the best indicators for beginner crypto investors?
Start with simple indicators like the 200-day SMA for trend direction, 20-day EMA for momentum, RSI for overbought/oversold conditions, and volume confirmation. Focus on daily timeframes which provide clearer signals with less noise than hourly or 15-minute charts. Master these basics before adding complexity. The best crypto trading indicators guide explains how to use each tool effectively.
How can I reduce risk while trading cryptocurrencies?
Diversify your holdings across multiple assets with low correlation to each other. Use stop-loss orders to limit downside on every position, typically 8-12% below entry for crypto’s volatility. Avoid excessive leverage which amplifies both gains and losses dangerously. Monitor market regime changes like shifts from risk-on to risk-off sentiment that can override technical signals. Implement reduce crypto trading risk strategies systematically rather than reacting emotionally to price swings.
What role do macroeconomic factors play in crypto trend analysis?
Macro factors significantly influence crypto trends, often overriding technical patterns. USD strength and gold price negatively affect BTC price and hash rate, while political events like elections or regulatory announcements create volatility spikes. Monitor Federal Reserve policy, dollar index movements, and geopolitical developments alongside your technical analysis. Bitcoin often correlates with risk assets during certain periods, moving with stocks rather than as an independent store of value.