TL;DR:
- Crypto market volatility is measurable, driven by factors such as 24/7 trading, fragmented liquidity, and high leverage, making it both intense and manageable. Investors who understand and track volatility signals can turn risk into opportunities, using tools like GARCH models, volatility indexes, and disciplined portfolio strategies. Mastering volatility is essential for consistent growth, as it reveals market psychology and guides strategic positioning rather than being an obstacle to avoid.
Crypto’s wild price swings feel random until you look closer. The truth is, volatility in cryptocurrency markets is measurable, driven by specific forces, and, most importantly, manageable once you understand its mechanics. Most investors treat volatility like bad weather: something to endure and hope passes quickly. But the investors who consistently grow their portfolios treat it as useful information, a signal embedded in price movement that tells a story about risk, opportunity, and market psychology. This guide walks you through everything you need to know, from definitions to models to practical strategy.
Table of Contents
- What is market volatility in cryptocurrency?
- Why is crypto so volatile? Core drivers and unique risks
- Measuring crypto volatility: Tools, models, and key indicators
- Not all volatility is equal: Stablecoins, altcoins, and crisis behaviors
- Managing and embracing volatility: Portfolio strategies that work
- Why mastering volatility is the ultimate edge for crypto investors
- Turn volatility into your portfolio advantage with CryptoCracker
- Frequently asked questions
Key Takeaways
| Point | Details |
|---|---|
| Volatility is measurable | Crypto volatility can be tracked with clear metrics and models, not just guessed. |
| Drivers differ from stocks | Crypto’s volatility stems from unique drivers like 24/7 trading, leverage, and sentiment. |
| Not all coins behave alike | Stablecoins, Bitcoin, and altcoins react differently to market shocks and volatility spikes. |
| Risk tools can help | Using risk-adjusted metrics and portfolio diversification lets you benefit from and manage volatility. |
| Volatility is an opportunity | Seeing volatility as a tool for growth can give you an advantage over the herd. |
What is market volatility in cryptocurrency?
Volatility, at its core, measures how much a price moves over time. In crypto, that movement tends to be dramatic, fast, and frequent compared to traditional assets like stocks or bonds. A stock might swing 2% in a week and make headlines. Bitcoin can move 10% in a single afternoon. That’s not chaos; it’s a feature of how crypto markets are structured.
There are two primary types of volatility that serious investors track. Realized volatility (also called historical volatility) captures how much prices have actually moved over a set period, calculated as the standard deviation of returns over 30 or 90 days. Implied volatility reflects what the market expects future volatility to be, derived from options pricing. A key benchmark here is the Deribit DVOL index, which models crypto implied volatility on the same methodology as the VIX, the traditional market’s most recognized fear gauge.
What makes crypto volatility uniquely intense? A few structural factors stand out:
- 24/7 trading means there’s no overnight pause for markets to absorb news. Prices react in real time, all the time.
- Fragmented liquidity across centralized and decentralized exchanges means a large trade can move prices more dramatically than it would in a unified, deep market.
- High leverage allows traders to bet far more than they actually hold, and when markets turn, forced liquidations add fuel to the fire.
- Sentiment-driven cycles amplify swings beyond what fundamentals alone could justify.
Understanding volatility is not about predicting the future. It is about knowing the terrain you are trading on.
Why is crypto so volatile? Core drivers and unique risks
Now that we have a clear definition in place, let’s explore why the crypto market is so uniquely turbulent, and what factors you should watch to stay ahead.
Volatility in crypto does not happen in a vacuum. It is the output of layered forces that interact and feed on each other. Fragmented liquidity across exchanges, combined with leverage ratios between 10x and 100x, creates an environment where liquidation cascades can strike hard and fast. When leveraged positions get force-closed, selling pressure compounds, which triggers more liquidations, which sends prices into a spiral. This happened repeatedly in 2021 and 2022.
The five core volatility drivers every crypto investor should know:
- Fragmented liquidity: Prices vary across exchanges, and thin order books mean large trades move markets.
- Leverage and liquidation cascades: High leverage amplifies both gains and losses, and mass liquidations accelerate price drops.
- 24/7 trading cycles: Unlike equity markets, there is no closing bell. News events overnight or on weekends hit prices immediately.
- Speculation, FOMO, and FUD: Fear of missing out and fear, uncertainty, and doubt drive herd behavior more powerfully in crypto than in almost any other asset class.
- Correlation with equities in crises: When global markets panic, crypto has increasingly moved with stocks rather than acting as a safe haven.
Good crypto risk assessment strategies begin with recognizing which of these drivers are active at any given time.
Pro Tip: Watch for sudden spikes in the DVOL index, a surge in leveraged long or short positions, and unusual volume on stablecoin pairs. These often signal a volatility event before the main price move happens.
Measuring crypto volatility: Tools, models, and key indicators
Knowing what causes volatility, the next step is understanding how to measure, track, and model it effectively.
Several indicators exist for monitoring crypto volatility, each serving a different purpose:
- Realized volatility: Historical price movement, usually expressed as annualized standard deviation.
- Implied volatility (DVOL): Forward-looking, derived from options markets on platforms like Deribit.
- BVIV and EVIV: Bitcoin Volatility Index and Ethereum Volatility Index, similar in concept to DVOL.
- CVI (Crypto Volatility Index): Tracks overall market fear, functioning as a sentiment gauge.
For investors who want to go deeper, statistical models provide richer insight. The GARCH family of models (which stands for Generalized Autoregressive Conditional Heteroskedasticity) are the industry standard for capturing two key crypto behaviors: volatility clustering (periods of high volatility cluster together) and fat tails (extreme events happen more often than normal distribution models expect).
| Model | Primary use | Unique strength | Best for |
|---|---|---|---|
| GARCH | Baseline volatility forecasting | Captures volatility clustering | General BTC modeling |
| EGARCH | Asymmetric shocks | Models leverage effect (bad news hits harder) | ETH analysis |
| TGARCH | Threshold effects | Distinguishes positive vs. negative shocks | BTC short-term forecasting |
| CGARCH | Long-memory volatility | Separates transient and persistent vol components | Long-term portfolio risk |
Research shows that TGARCH is optimal for modeling Bitcoin, while EGARCH fits Ethereum best, due to ETH’s more pronounced sensitivity to negative market shocks. Most retail investors simply look at a price chart and estimate risk visually. That misses the clustering patterns and tail risks that these models quantify precisely.
Using trend indicator strategies alongside volatility models gives you a far clearer picture of when a move is likely to continue versus when it is noise. Similarly, integrating these signals into portfolio optimization methods helps you size positions appropriately given current risk conditions.
Not all volatility is equal: Stablecoins, altcoins, and crisis behaviors
With the basics of volatility metrics in place, it is crucial to see that not all crypto assets behave the same, especially in turbulent times.
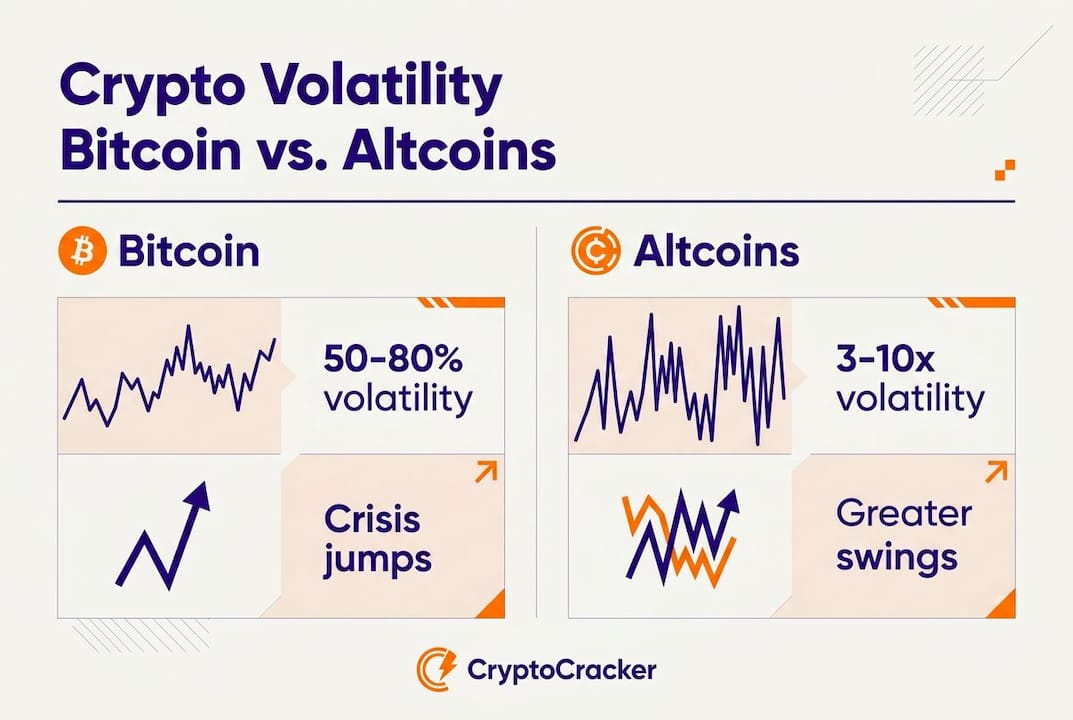
Bitcoin is the benchmark, but it is not the most volatile asset in crypto, not even close. Altcoins exhibit three to ten times BTC’s volatility, driven by lower liquidity, smaller market caps, and more concentrated speculative activity. A midcap altcoin can lose 40% in a single day on nothing more than a shift in market sentiment. Fat tail events, those extreme price moves that standard models underestimate, happen with striking frequency in the altcoin space.
Stablecoins sit at the other extreme, but they carry their own risks. USDT and USDC show very low day-to-day volatility. Their entire purpose is price stability. But when a stablecoin loses its peg, the consequences are severe. TerraUSD (UST) in 2022 is the defining example: a so-called stable asset collapsed to near zero within days, wiping out tens of billions in value. That kind of risk is not captured by standard volatility metrics precisely because it lives in the tail.
During major crises, regime-switching volatility emerges. This refers to the way markets shift from one behavioral state to another abruptly. During COVID in early 2020, crypto markets moved in lockstep with equities during the initial panic, throwing any assumption of diversification out the window. Wars, regulatory shocks, and macroeconomic crises all trigger similar regime shifts.
| Asset | Typical volatility | Crisis behavior | Key risk |
|---|---|---|---|
| Bitcoin (BTC) | High (50-80% annualized) | Moderate correlation with equities | Liquidation cascades, macro shocks |
| Ethereum (ETH) | Higher (60-100% annualized) | Amplified BTC moves | Protocol risk, leverage sensitivity |
| Typical altcoin | Very high (150-300%+) | Extreme sell-offs | Liquidity collapse, fat tails |
| USDT/USDC | Near zero (under 1%) | De-peg risk in extreme events | TerraUSD-style collapse scenarios |
Good crypto diversification benefits come from understanding these differences and deliberately building a portfolio that balances higher-volatility assets with lower-volatility positions.
Pro Tip: Never assume “stable” means “safe.” Stablecoins reduce daily price risk but introduce de-peg risk. Always know the collateral structure and redemption mechanism behind any stablecoin you hold.
Managing and embracing volatility: Portfolio strategies that work
Once you understand the nature of crypto volatility, the next step is managing it strategically to turn risk into opportunity.

Most investors instinctively reach for the Sharpe ratio when evaluating their portfolio performance. The Sharpe ratio measures return per unit of total volatility, meaning it penalizes upside swings just as much as downside ones. In crypto, where positive volatility often represents the gains investors are there to capture, this creates a distorted picture of risk. Using Sortino and Omega ratios instead focuses your attention on downside risk, giving you a more accurate sense of how well your portfolio is actually performing relative to real losses rather than all price movement.
Practical actions you can implement right now to manage volatility with more precision:
- Measure before you manage: Use realized volatility data alongside implied volatility to understand both current and expected market conditions before making trades.
- Diversify across volatility regimes: Hold a mix of BTC, ETH, select altcoins, and stablecoins. Do not let one high-volatility position dominate your entire portfolio exposure.
- Use VaR and ES for downside modeling: Value at Risk (VaR) and Expected Shortfall (ES), calculated with GARCH models, give you clearer boundaries on potential losses during volatile periods.
- Monitor fear gauges: Track the CVI, BVIV, and EVIV indexes regularly. When fear gauges spike, it often signals a volatility regime shift is underway.
- Set rules, not reactions: Define in advance when you will reduce exposure, rebalance, or add to positions. Emotional decisions during volatility spikes destroy returns.
Reducing crypto trading risk starts with data, not gut feeling. And exploring crypto optimization strategies helps you apply these principles consistently over time rather than only when markets are calm.
Pro Tip: Most investors misuse volatility data by looking at it retrospectively to justify decisions they already made emotionally. Use volatility metrics prospectively: set thresholds before a trade that define your risk tolerance, then hold yourself to them.
Why mastering volatility is the ultimate edge for crypto investors
Here is an uncomfortable truth: most investors treat volatility like a problem to be solved or an obstacle to be avoided. We think that framing misses the point entirely.
The investors who consistently outperform in crypto are not the ones who found a way to eliminate volatility from their portfolios. They are the ones who learned to read it, anticipate it, and position around it. Volatility is not the market malfunctioning. It is the market communicating. It tells you where fear and greed are concentrated, where liquidity is thin, and where price is likely to overextend in either direction.
The conventional wisdom says: reduce risk, increase stability, smooth your returns. We are not arguing against that for defensive positioning. But there is a real cost to being overly defensive in a market that rewards those who can hold through periods of high realized volatility and come out on the other side with more than they started with.
Following crypto investor best practices is not about avoiding every volatile moment. It is about having a systematic framework so that when volatility hits, you are not scrambling. You know your downside limits. You know what regime you are in. And you know whether the current swing represents risk to hedge or opportunity to capture.
The winners have a playbook. Everyone else gets swept up in the noise, selling at the bottom and buying at the top because the emotions of the moment overrode the data. Build the playbook first.
Volatility is not the enemy. Misunderstanding it is.
Turn volatility into your portfolio advantage with CryptoCracker
You have seen how volatility can become your edge. Here is where the right tools make all the difference.
CryptoCracker is built to give you the clarity that most investors are missing. Our crypto market analysis tool surfaces real-time volatility signals, performance trending indicators, and actionable insights so you are never flying blind when markets move fast.

Whether you are tracking how your holdings respond to volatility events or fine-tuning your strategy with data-driven recommendations, CryptoCracker puts the tools in your hands without the complexity. You can track crypto portfolio performance with our dashboard, monitor risk metrics, and receive personalized suggestions, all in one secure, EU-compliant platform. Volatility is not going away. Let’s make it work for you.
Frequently asked questions
How is crypto volatility different from stock market volatility?
Crypto volatility is typically higher and driven by 24/7 trading and high leverage, fragmented liquidity across exchanges, and global sentiment swings that have no equivalent in equity markets.
What are the best indicators for measuring crypto market volatility?
The key indicators are realized and implied volatility, including the Deribit DVOL index modeled on the VIX, alongside GARCH-family models for deeper statistical analysis.
Why do altcoins experience higher volatility than Bitcoin?
Altcoins often show three to ten times the volatility of Bitcoin, driven by lower liquidity, smaller market caps, and a much higher concentration of speculative trading activity.
Do stablecoins eliminate volatility risk?
Stablecoins reduce day-to-day price fluctuation but carry serious de-peg risks in extreme events, as demonstrated by the TerraUSD collapse in 2022, which wiped out billions in value within days.
How can investors turn volatility into an advantage?
By tracking the right metrics and using Sortino and Omega ratios alongside GARCH modeling for VaR and ES, investors can measure real downside risk, diversify intelligently, and position to capture upside rather than simply endure swings.